The Double-edged sword of BioNTech & Pfizer
The patent technology related to the EMA document improves the yield of RNA while increasing the residual DNA.
We discovered a pivotal new patent application related to the EMA document. We call further verification for this patent by experts and volunteers.
The DNA contamination is a major concern in the mRNA vaccine technology. The patent we discovered this time discloses a novel method to increase not only the quality and yield of the RNA but also the residual DNA. This suggests that this method is one of the major causes of the DNA contamination in the mRNA vaccines.
The patent publication number is US20230183769A1 and the applicant is BioNTech SE.
The US20230183769A1 was filed on August 23, 2022, and published on June 15, 2023. This patent application has not been registered yet. This patent application claims priority to the provisional application 63/236,660 filed in the USPTO on August 24, 2021. The US20230183769A1 has an international patent application WO2023025404A1 as a patent family.
The filing date of this case patent is deemed to be August 24, 2021.
This patent discloses experiments underlying the EMA document on BNT162b1 and BNT162b2 of the BioNTech (Pfizer), and will reach to one cores of the residual DNA contamination problem.
If it is based on the disclosures of this patent and the EMA document, BioNTech and Pfizer recognize that their manufacturing method increases the residual DNA.
That is, in the actual manufacturing process, BioNTech (Pfizer) makes the residual DNA amount (DNA:RNA) look very small by using the qPCR that underestimates the residual DNA amount and the fluorometry that overestimates the RNA amount while adopting the manufacturing method that inevitably increases the residual DNA.
BioNTech articulates the trade-off between an improving the RNA quality and an increasing the residual DNA in relation to a concentration of CTP (cytidine triphosphate), in the para [0437] and the figure 16 of this patent.
[0437]…Both RNA yield and integrity increased with higher CTP starting concentrations, while dsRNA content decreases with higher CTP concentration. Residual DNA was increased with higher CTP starting concentration (FIG. 16).
BioNTech makes the following assumption regarding the increase in the residual DNA.
[0437]…Without wishing to be bound by any one theory, residual DNA may have increased with higher CTP starting concentration due to activity of DNase I being decreased from, for example, lower free magnesium cation levels.
The figure 16 shows the residual DNA amounts measured at the concentrations of CTP of 0%, +10%, +20% and +50%. According to the EMA document, BioNTech uses a rough calculation that assumes a uniform denominator of 30 ug when calculating the residual DNA amount. Therefore, the residual DNA amount shown in the figure 16 is probably calculated following that calculation method.
The overall process conditions in the figure 16 are disclosed in Table 2.1. These concentrations correspond to the IVT conditions indicated in the EMA document.
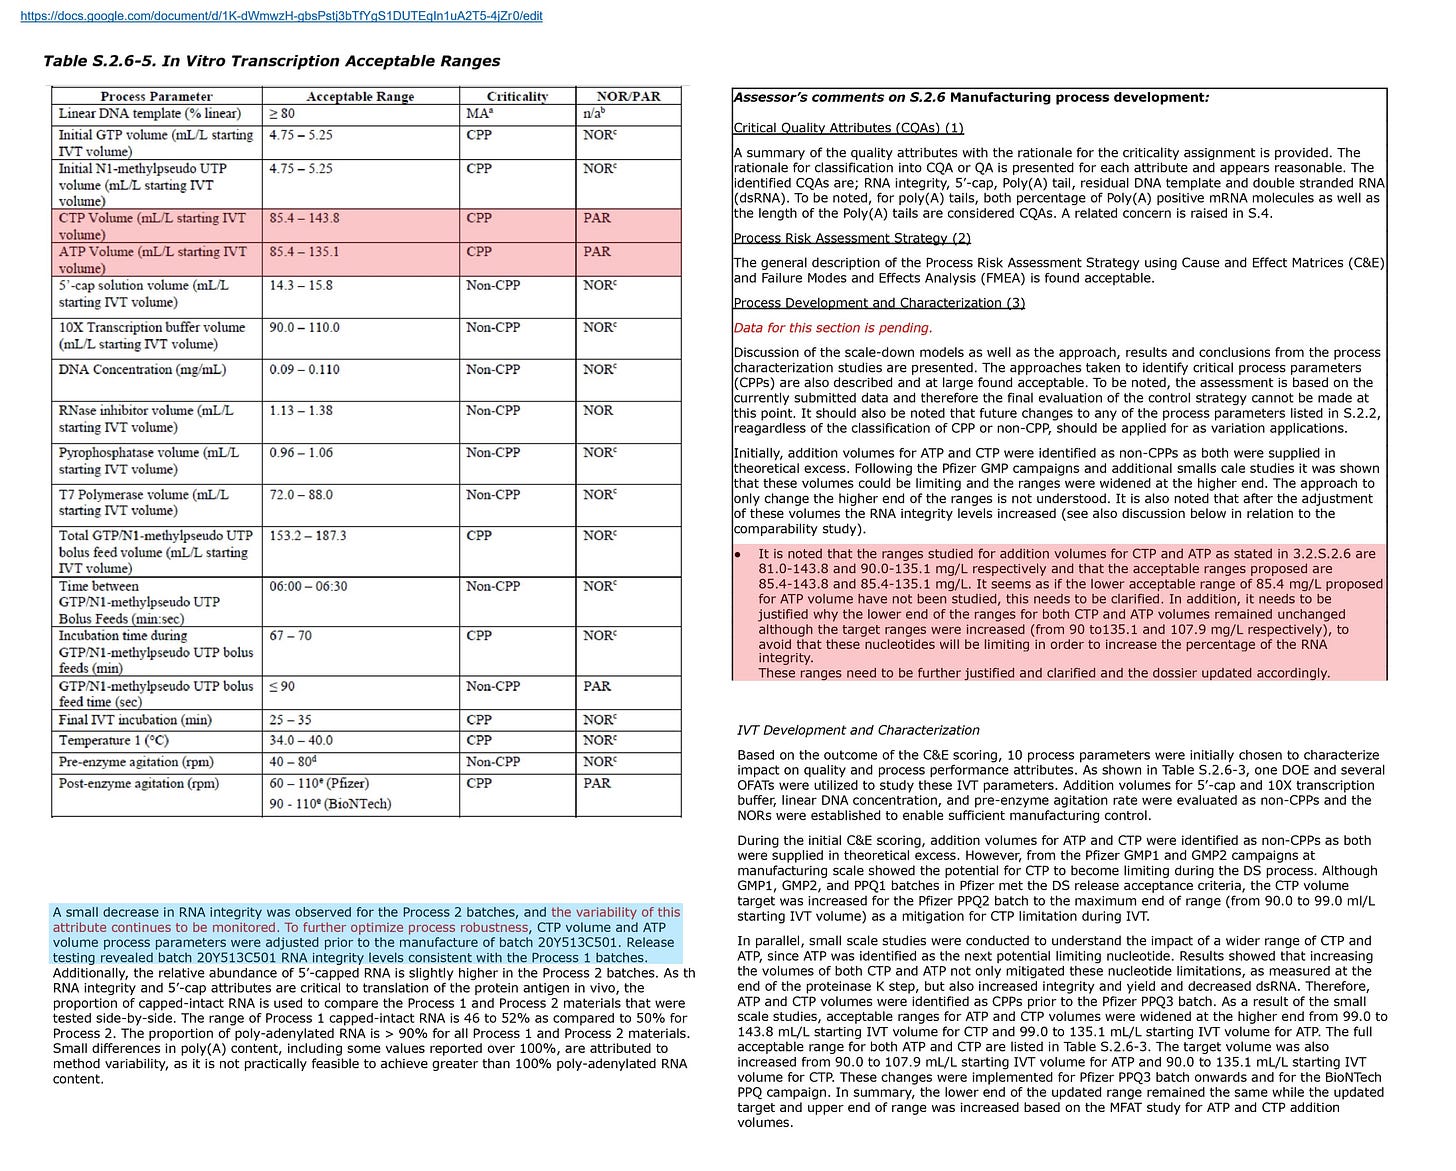
BioNTech discloses the specific amounts of CTP and ATP (adenosine triphosphate) in the paras [0341] and [0342]. In the Table 2.4, the amounts of CTP is set to 144 mL/L starting volume. Those amounts match the amounts indicated as the acceptable ranges in the EMA document.
It is obvious that the acceptable ranges for the concentrations of CTP and ATP indicated in the EMA document are based on the experimental results disclosed in this patent. These acceptable ranges are the range that improve the RNA quality but increase the residual DNA.
The figure 2 (see para [0046]) discloses the construct 1 as BNT162b1 and the construct 2 as BNT162b2. On the other hand, the figures 16 and 18 disclose the constructs X as the DNA templates, but it is not identified which one was applied. Note that BNT162b1 is the mRNA of 1262 nt that translates a part of the spike region, and the design of which is different from that of BNT162b2. Both BNT162b1 and BNT162b2 are different in concept from the Processes 1 and 2.
The figure 16 discloses the data immediately after the proteinase K treatment, and the RNA yield was theoretically calculated (see paras [0423] and [0432]). The RNA integrity was assessed by the digital droplet polymerase chain reaction (ddPCR).
On the other hand, in the figure 18, after IVT, the DNA template was removed via DNase and the RNA was purified using immobilized magnetic beads (see para [0428]). Additionally, the RNA was eluted with water, the RNA concentration was measured by UV (Nanodrop), and IVT yield was calculated. The RNA integrity was analyzed using an Agilent Bioanalyzer.
Based on the RNA yield and the residual DNA amount disclosed in the figures 16 and 18, it is assumed that the Processes 1 and 2 correspond to either of the figures 16 and 18, but it seems that a simple comparison cannot be made since the measurement steps, the measurement methods, the measurement principles, etc. are different.
Regarding these points, we have not conducted specific verification as our priority is to provide this patent information to the public as soon as possible. These require further verification.
The correspondences between the patent disclosure and the EMA document may be as follows. Note that these correspondence relationships require further verification.
(I) The two batches R443 and R445 categorized in the Process 1 using the magnetic beads may correspond to the standard in the figure 18 of the patent.
(II) The four batches C101 to C104 categorized in the Process 2 may correspond to the standard in the figure 16 of the patent.
(III) It is unknown about the successor batch C501 categorized in the Process 2, but it is presumed that the concentration of CTP is extremely high due to improved RNA integrity, decreased RNA amount, and increased residual DNA amount.
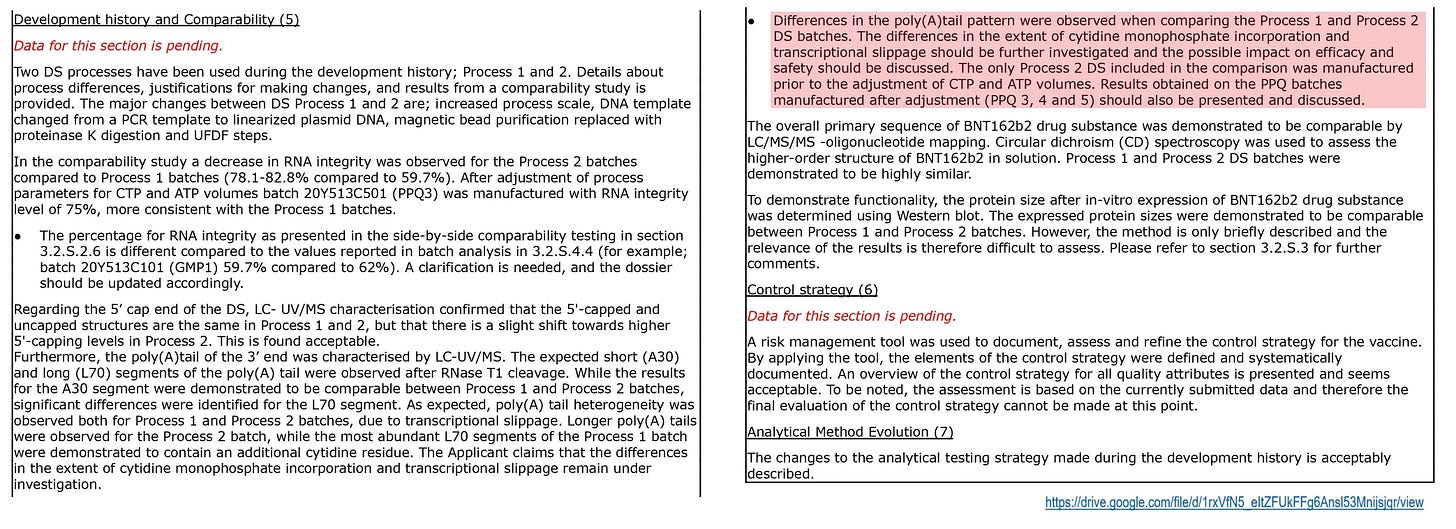
As an evidence, the EMA document remarks that the process rules were changed immediately before applying the batch C501, and both the concentrations of CTP and ATP were increased. This process rule is called as PPQ3.
The process rules have changed for the subsequent batches as well, and PPQ4 was applied to the batch C601 and PPQ5 was applied to the batch C701.
Further subsequent process rule was applied to the batch 21Y513C6101 disclosed in the TGA document. However, considering the residual DNA amount and the patent disclosure, it is considered that the increased concentrations of CTP and ATP in the PPQ3 are being applied as they are.
Regarding changing from the prior process to the PPQ3, the EMA points out the Pfizer's inconsistency in stating the benefits of increasing the upper limits of those concentrations, but failing to provide a justification for keeping the lower limits as they are.
It can be inferred that the decreasing of the yield and quality of the RNA is one of the reasons for this based on the patent disclosure, but keep in mind that this will become an important theme in the future.
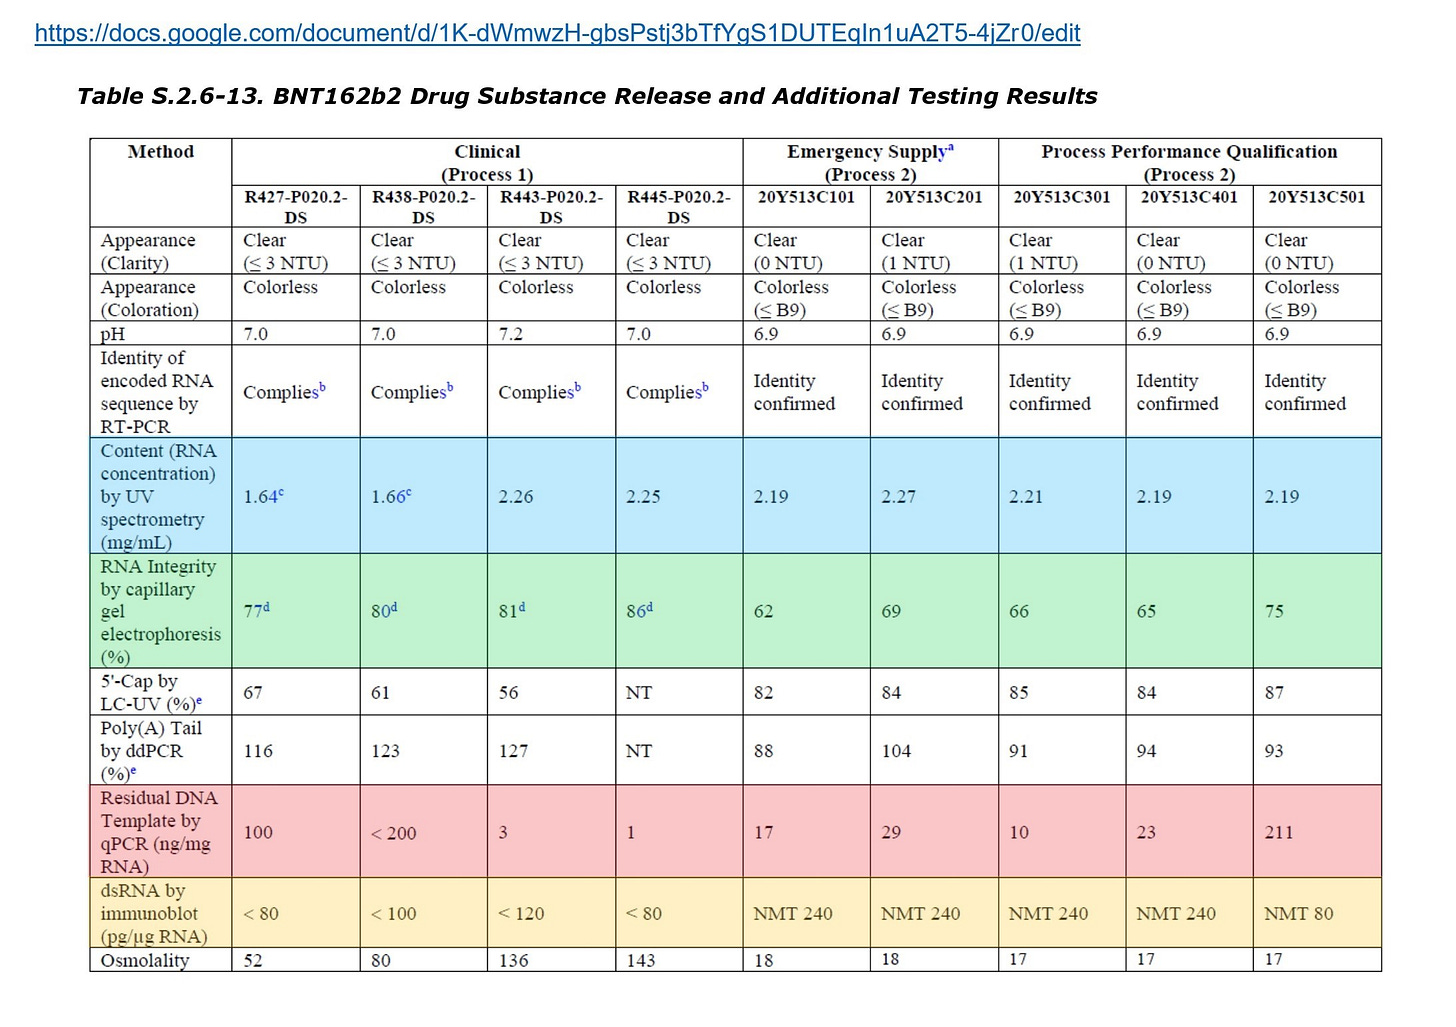
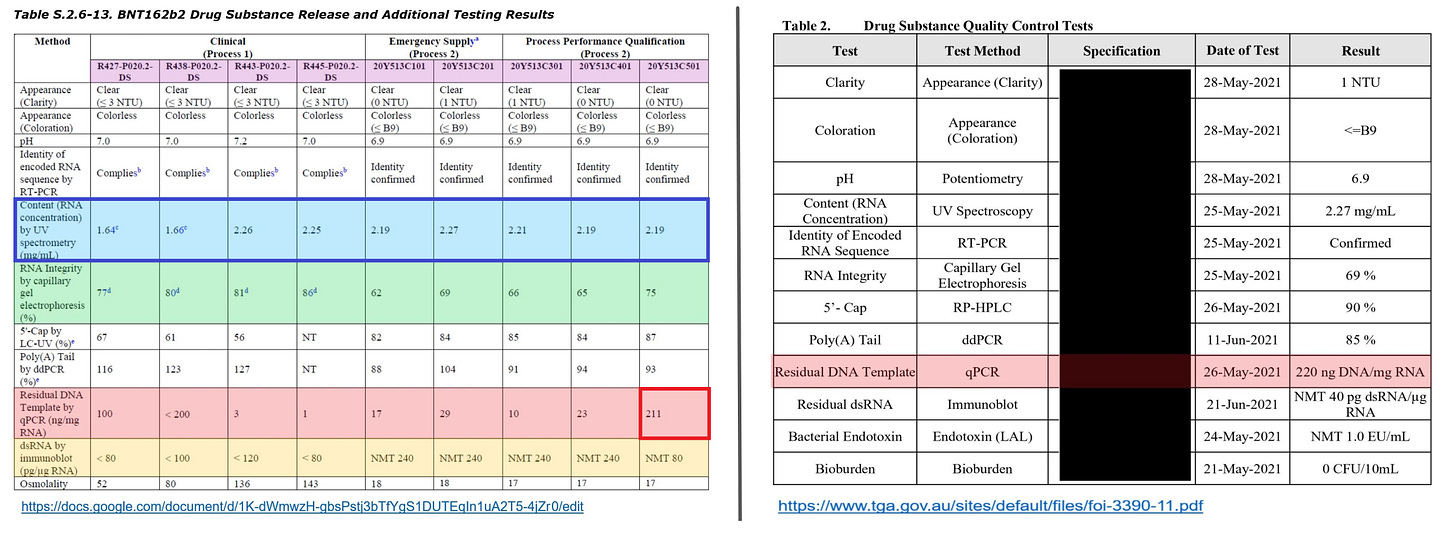
The residual DNA amount of the batch C501 disclosed in the EMA document is 211 ng/mgRNA (see attached above image), and the residual DNA amount of the batch C6101 disclosed in the TGA document is 220 ng/mgRNA.
Those batches are successor batches to other batches manufactured through the Process 2, but the residual DNA amounts of them are much higher than those of the previous batches.
The qualities of the batches should be improved according to the chronological order, but the residual DNA amounts increased by nearly 10 times. This is extremely unnatural. Also, as the RNA yield becomes large, the amount of fluid required for adjustment also becomes large, and thus the residual DNA amount becomes small accordingly. However, on the contrary, the residual DNA amount increased.
The acceptable range for the RNA yield is set to 2.00 to 2.50 mg/mL, but there is no improvement in the RNA yield as far as the EMA document is concerned.
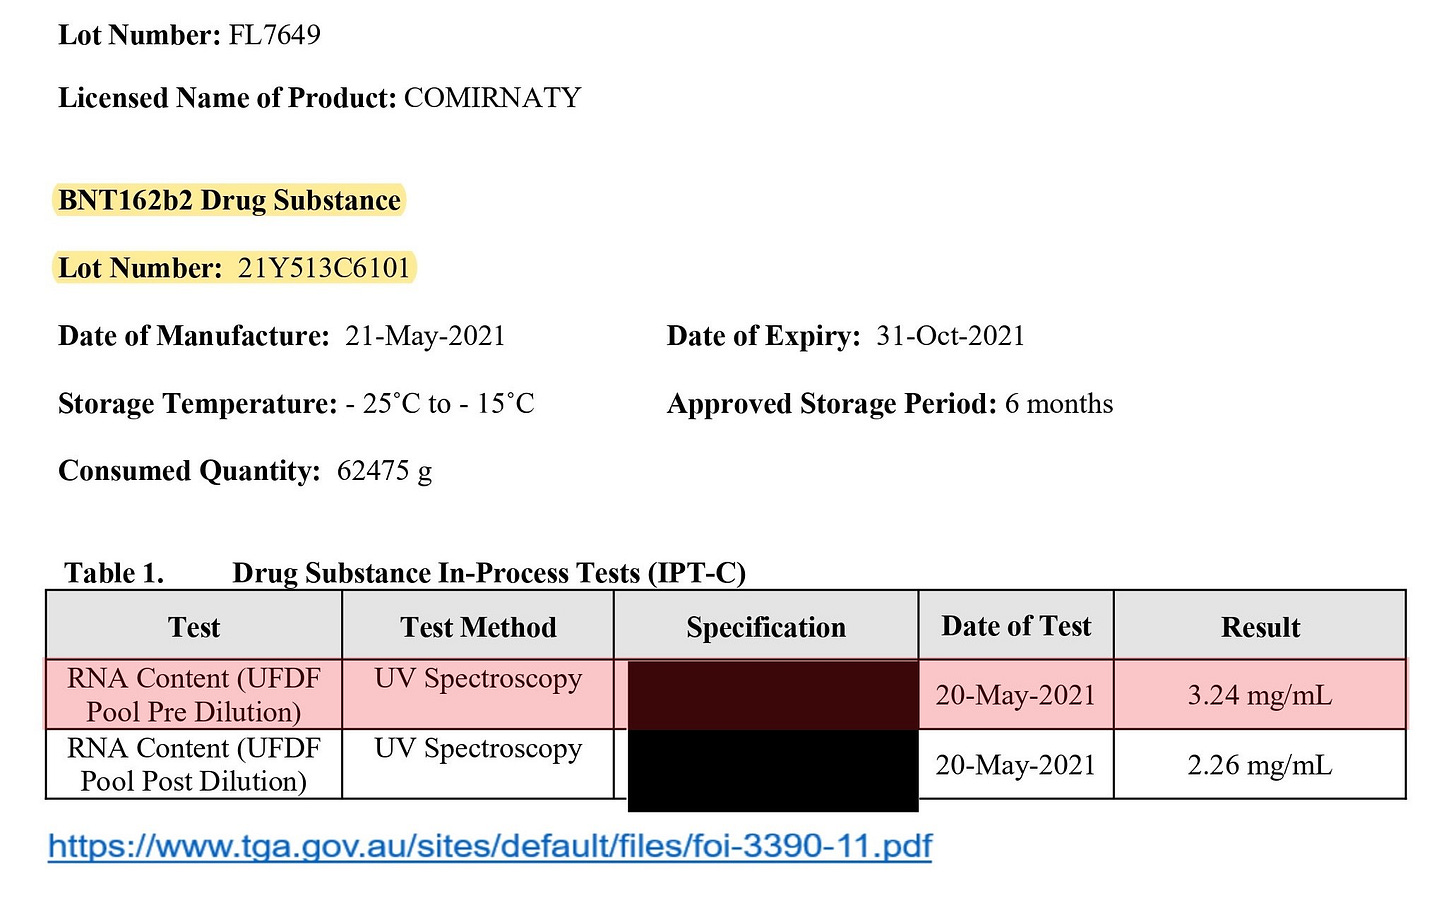
In this connection, referring to the TGA document, the concentration of the RNA yield before the dilution is disclosed (=3.24 mg/mL), and this concentration is much higher than that of the EMA document.
That is, this means that the acceptable range shown in the EMA document is the one after the dilution, and if the concentration before the dilution is high, it will be adjusted to within the acceptable range (=2.00 to 2.50 mg/mL) in the subsequent process.
In other words, the RNA yield cannot be determined from the data after the dilution, and the actual RNA yield cannot be determined unless checking the data before the dilution. According to the EMA document, the RNA yield was adjusted to around 2.20 mg/mL. This patent is meant to improve the RNA yield before the dilution.
This patent was discovered while exploring the causes of those contradictions. This patent explains the discrepancies existing in the EMA document and the TGA document by the concentrations of CTP and ATP and resolves various questions.
This patent technology is a double-edged sword that improves the RNA yield before dilution while increasing the residual DNA amount, and is the method actually adopted in the manufacturing method of BioNTech (Pfizer).
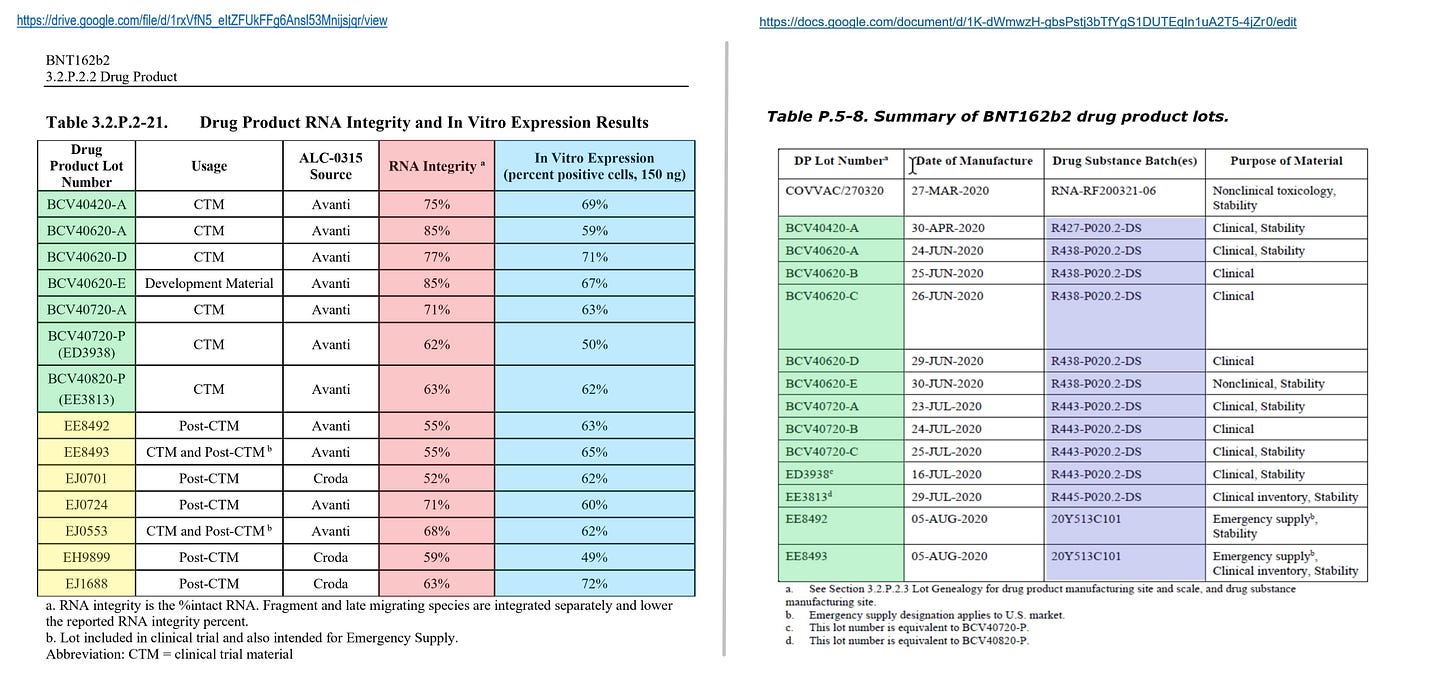
Pfizer insists in the Drug Product document that there is no relationship between the RNA integrity and the expression rate of the spike protein, but the RNA integrities are 50% - 85%, and this variation is so large that it cannot be overlooked (see attached table 3.2.P.2-21). The issue of whether the incomplete RNA expresses the spike protein is discussed in detail in the #Blotgate from Jikkyleaks and will not be discussed here.
Note that all the lots shown in Table 3.2.P.2-21 are from before the process rule PPQ2, and EMA has sharply pointed out that the process rule PPQ3 and later results of these electrophoresis tests should also be submitted and discussed.
The lots having "BCV" in their name are the lots produced through the Process 1 at the DP (Drug Product) stage. From this table it is understood that variations exist even through the purification using magnetic beads.
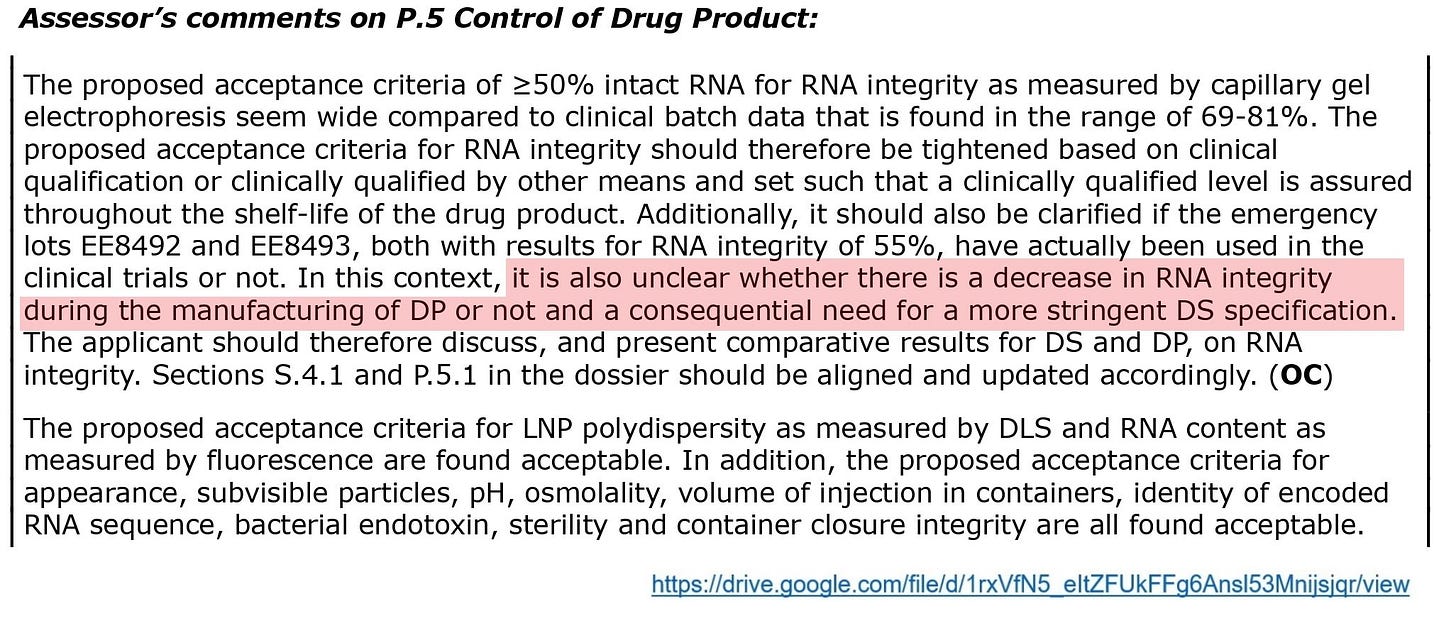
At the DP stage, the RNA integrities of the lots after BCV40720A (that is, after R443) are quite low, but there is comparatively high data at the drug substance stage. Therefore, it cannot be denied that there may be large variations among IVTs in the first place. Or, as it is pointed out by EMA, the RNA integrity may have been decreased during the DP stage.
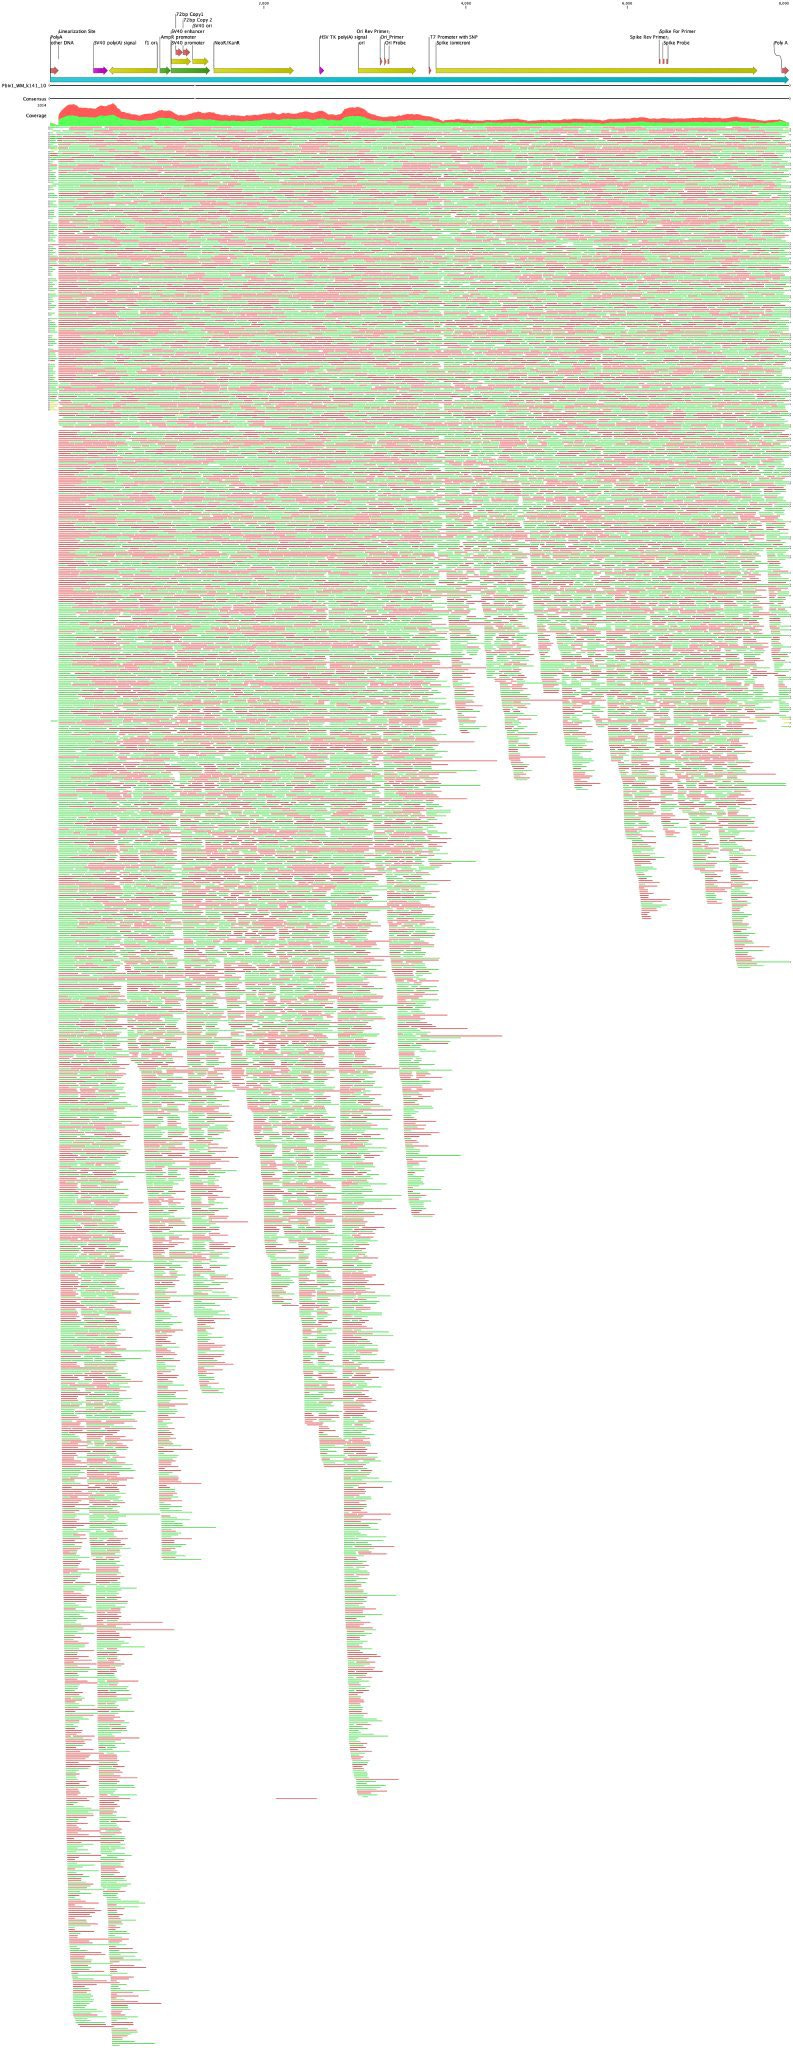
Considering ONT data (from Kevin McKernan, et al.) relating to the residual DNA, it is considered that an increase in the concentration of CTP could be one of factors in the vector backbone. In addition, in the spike region, the formation of the DNA/RNA hybrids and the increase in the concentration of CTP could be some of factors.
Last but not least, this patent discloses the technical problem at the para [0007] as follows:
BioNTech (Pfizer) seems to have solved this technical problem in the patent specification, but it seems that it has not been solved in the real world.
Remember that the underestimated residual DNA is wrapped in the LNP and introduced into the human body. The LNP increases all risks associated with the residual DNA.
Our verification has many limitations and is still insufficient. We hope that you will use this as a springboard for lively discussion.
~Digression~
(I) Views to the DNase I
We referred to views of Thermo Fisher and Merck during the investigation of this matter. Their views regarding the DNase I on an exposed single strand appear to contradict each other.
Considering both companies' views, BioNTech's patent and the EMA document, one suspicion arises that an incomplete damage could be occurred to a single strand. This is also a matter of concern, so please pay attention to them.
(II) Endotoxin
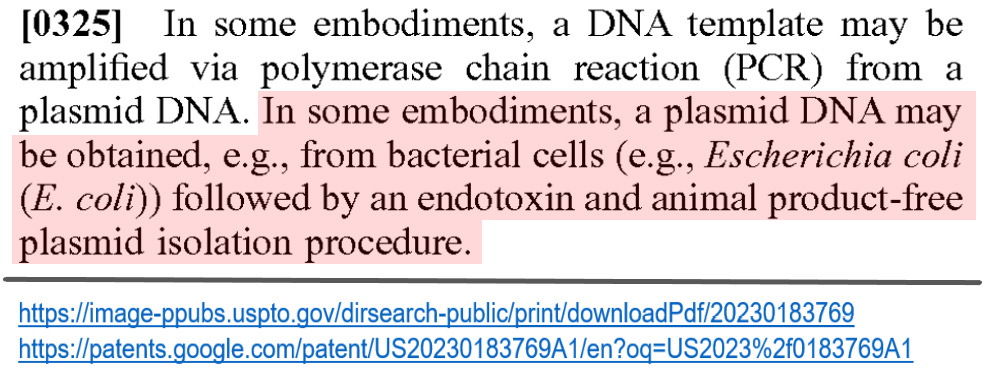
Geoffrey Norman Pain san pointed out the description regarding endotoxin in the para [0325] of this patent. Information on this is mentioned in detail in his Substack.
Thank you.
Cultivate 2
mbi
Patent SUN
Reference lists
US20230183769A1 (USPTO)
https://image-ppubs.uspto.gov/dirsearch-public/print/downloadPdf/20230183769
US20230183769A1 (Google)
https://patents.google.com/patent/US20230183769A1/en?oq=US2023%2f0183769A1
WO2023025404A1 (Google)
https://patents.google.com/patent/WO2023025404A1/en?oq=US2023%2f0183769A1
EMA document
https://docs.google.com/document/d/1K-dWmwzH-gbsPstj3bTfYgS1DUTEqIn1uA2T5-4jZr0/edit
TGA document
https://www.tga.gov.au/sites/default/files/foi-3390-11.pdf
Annex 1 - Draft 3.2.P.2.2 Frug Product
https://drive.google.com/file/d/1rxVfN5_eItZFUkFFg6Ansl53Mnijsjqr/view
Thermo Fisher
Merck
https://www.sigmaaldrich.com/JP/ja/products/protein-biology/proteins-and-enzymes/nucleases





Wow. Impressive work and very well explained.
What is going on with the magnesium levels? Looked at the EMA document and nothing specific was found. Bet the FDA knows all this. Plus it explains the EMA asking for further work on the DNAse 1.
Also, I have always wondered why BioNTech didn't use its new nifty cellulose based chromatography method which gets rid of 90% of the dsRNA? Maybe it wasn't enough or not enough RNA yield.
https://www.ncbi.nlm.nih.gov/pmc/articles/PMC6444222/
Subtitle suggestion: Fun With Numerators and Denominators.